
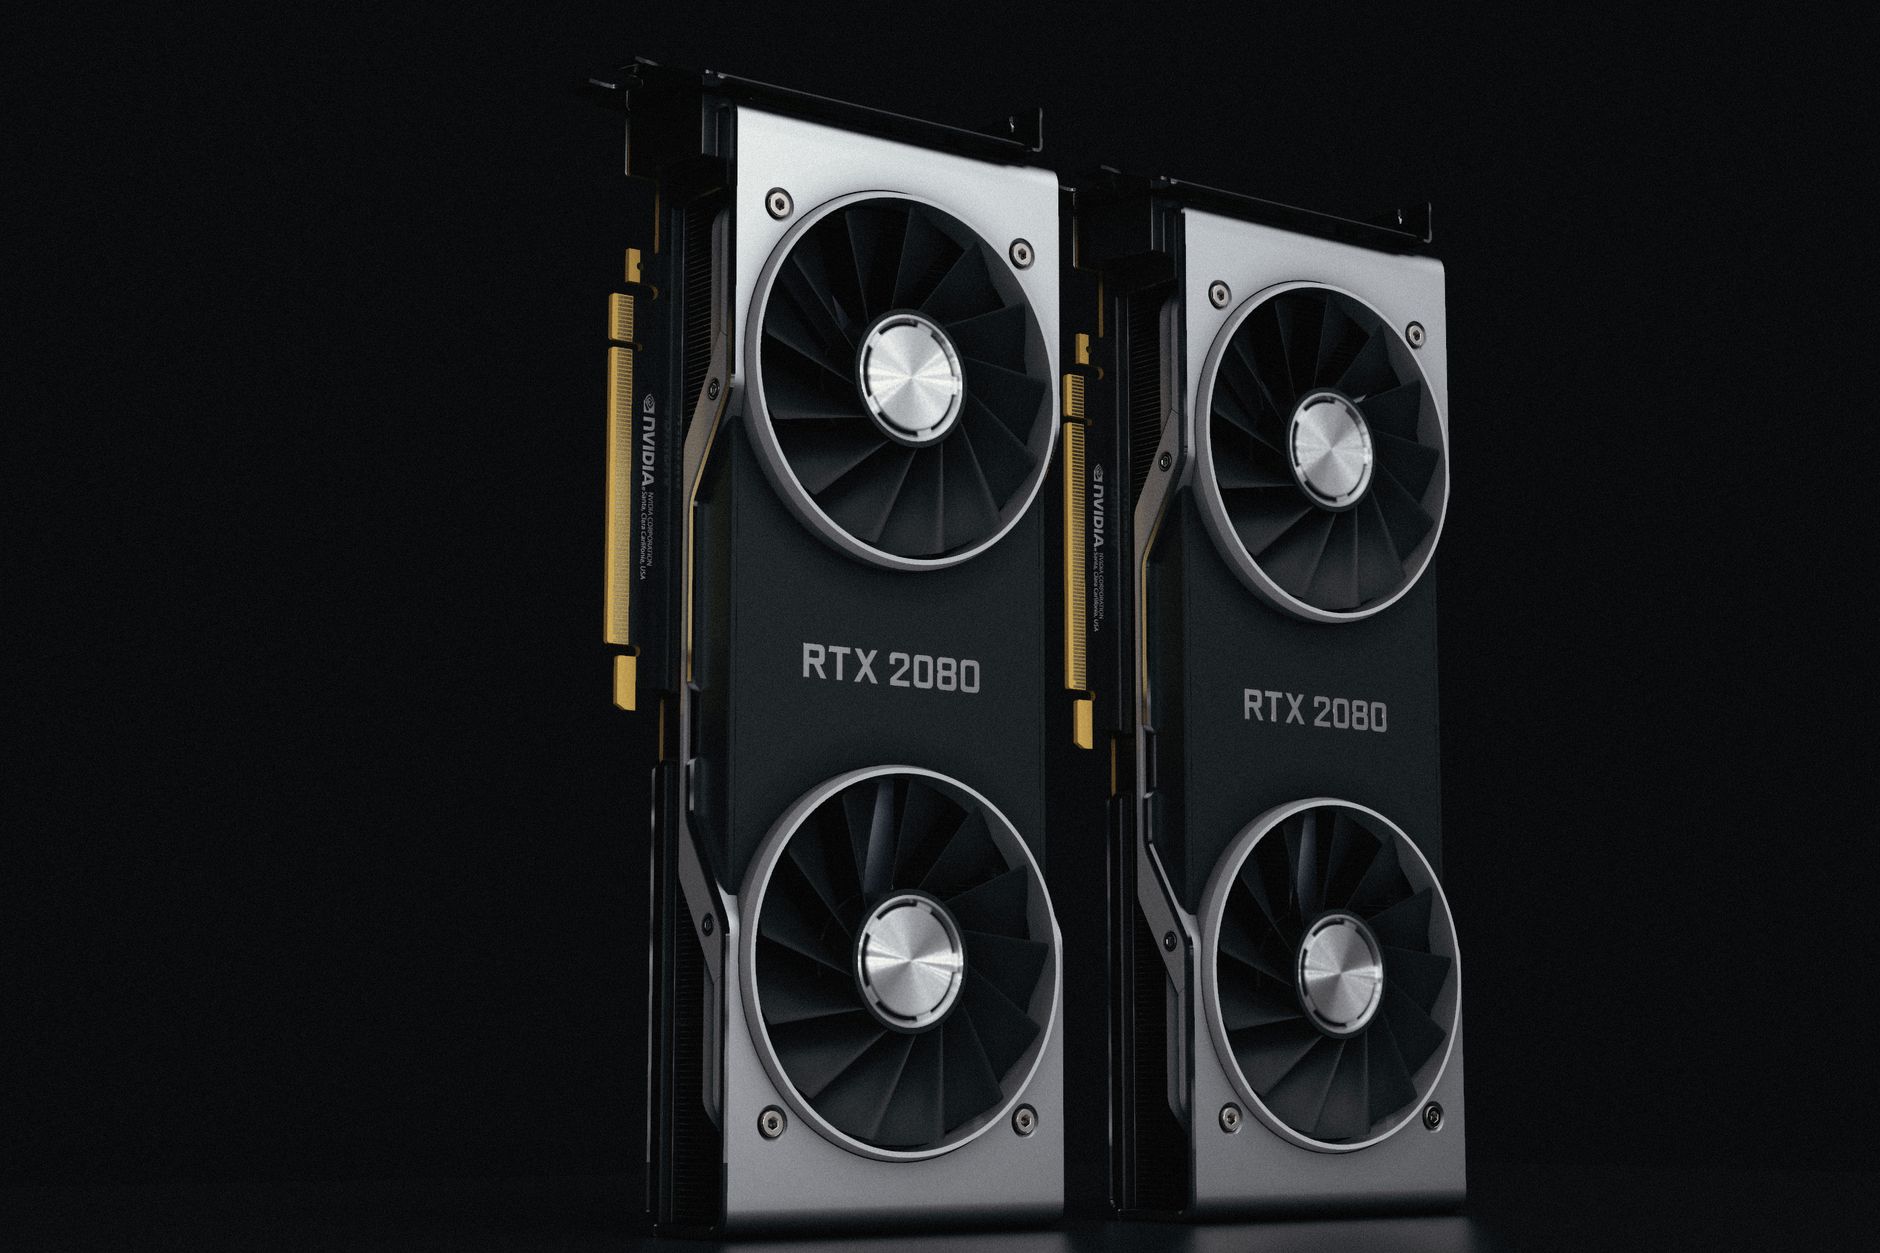

Analyzing an RTX GPU graph requires looking across multiple generations of NVIDIA architecture to understand how performance, core counts, and memory configurations have evolved. From early ray-tracing pioneers to modern professional visualization powerhouses, tracking these hardware metrics helps builders and creators select the right hardware.
Evaluations of modern video cards rely on structured databases—such as the GN Mega Charts—to map out generational performance scaling across the RTX 20, RTX 30, RTX 40, and RTX 50 series.
Evolution of Consumer GeForce RTX Architecture
The progression of consumer-facing graphics cards showcases a massive jump in both computational units and clock speeds. Official NVIDIA specifications demonstrate how architectural efficiency has scaled:
- RTX 20 Series: Introduced hardware-accelerated ray tracing with cards like the RTX 2080 Ti packing 4,352 CUDA cores and a boost clock of 1.64 GHz.
- RTX 30 Series: Ampere architecture scaled core counts drastically, with the RTX 3090 Ti jumping to 10,752 CUDA cores and an 1.86 GHz boost clock.
- RTX 40 Series: Ada Lovelace architecture introduced massive leaps in efficiency and throughput, highlighted by the RTX 4090 featuring a staggering 16,384 CUDA cores.
- RTX 50 Series: Representing the latest tier of gaming hardware, flagship cards like the upcoming consumer options utilize advanced silicon such as the GB202 GPU framework.
Professional Visualization and Workstation RTX Performance
While gaming benchmarks focus on frame rates in titles like Dying Light 2, workstation graphics cards are measured by their ability to handle neural graphics, complex simulations, and heavy artificial intelligence workloads.
The NVIDIA RTX 6000 Ada Generation serves as a prime platform for creators, incorporating 48GB of GPU memory and advanced programmable shader technology to handle real-time rendering and metaverse simulation workflows. Moving forward, the upcoming RTX 6000 Blackwell Generation shifts boundaries further by integrating up to 96GB of onboard GDDR7 memory on a 512-bit bus. This massive memory pool caters directly to heavy AI applications, data science, and advanced professional visualization (ProViz) requirements where consumer cards fall short.
Comparative Architectural Specifications
To better understand how GPU engines scale across generations, examine the core counts and hardware specs of selected flagship reference points:
| Graphics Card Series | Architecture | Max CUDA Cores / Processing Units | VRAM Capacity & Type |
|---|---|---|---|
| GeForce RTX 2080 Ti | Turing | 4,352 CUDA Cores | 11GB GDDR6 |
| GeForce RTX 3090 Ti | Ampere | 10,752 CUDA Cores | 24GB GDDR6X |
| GeForce RTX 4090 | Ada Lovelace | 16,384 CUDA Cores | 24GB GDDR6X |
| RTX 6000 (Ada Generation) | Ada Lovelace (Pro) | Advanced ProViz Spec | 48GB GPU Memory |
| RTX 6000 (Blackwell Generation) | Blackwell (Pro) | Up to 24,576 CUDA Cores (192 SMs) | 96GB GDDR7 |
When mapping out your hardware needs using any benchmark graph, always cross-reference raw compute specs with your specific software environment—whether you require high refresh rate gaming performance or extreme VRAM pools for deep learning workflows.
Frequently Asked Questions
What generations of NVIDIA graphics cards are included in current RTX GPU performance charts?
Current performance databases and mega charts span multiple generations, tracking architectures starting from the NVIDIA RTX 20 series, moving through the RTX 30 and RTX 40 series, up to the latest RTX 50 series hardware.
How do workstation RTX cards compare to consumer GeForce RTX cards in memory capacity?
Workstation solutions emphasize massive memory pools for digital content creation and artificial intelligence workloads. For instance, the Ada generation RTX 6000 features 48GB of GPU memory, while upcoming Blackwell generation ProViz boards are slated to feature up to 96GB of onboard GDDR7 memory.
Where can I find reliable, historical benchmark data for older and newer video cards?
Comprehensive performance metrics are tracked across industry databases like the GamersNexus Mega Charts, which evaluates everything from older RTX 20 series hardware to modern architectures using standardized test suites like Dying Light 2.
References & Sources
- NVIDIA’s New Ada Lovelace RTX GPU Arrives for Designers and Creators
- Nvidia's RTX Blackwell workstation GPU spotted with 96GB GDDR7 — ProViz GPU with a 512-bit bus
- GN Mega Charts: GPU Benchmarks & Comparison | GamersNexus
- Compare Current and Previous GeForce Series of Graphics Cards | NVIDIA
- GPU Comparison Charts – Zach's Tech Turf
Editorial Note: This article was researched via verified live web sources and published on 2026-10-15. Questions or feedback? Contact the editorial staff at TrendsInNews.
Photo credit: Nana Dua / Pexels